IDALS Equipment & Methods
Samples & Sources
All experimental samples studied are initially categorized in one of 5 forms: powder (submicron to micron scale), nanocrystals, grains, chunks, rocks. Alternate categories ("scrape off slide" or "aerosol spray") are in rare use. When samples are listed as "depleted," the sample has been used up and further measurements cannot be made. For the majority of the remaining mineral species, several grams' worth of material are still available for study. Commercial suppliers have included Alfa/Aesar, Excalibur Mineral Company, and Morion Company. Most samples are donated by individuals, as listed in our archived tables and publication acknowledgments; we thank them for their continued contributions.
Sample Preparation
| Mineral spectra produced using the thin film method are directly applicable to astrophysical contexts without further manipulation of the data [1]. For each mineral sample, optically thin (< 1 micron) films are created via compression in a Mao-Bell diamond anvil cell (DAC) sample mount. Each cylindrical component of the DAC (a hollow metal barrel nested about an inner metal piston -- see Fig. 1) contains a dark gray WC rocker onto which is mounted a Type II diamond anvil of about 1/3 carat with a cutlet (or tip) diameter of ~ 0.6 mm. Type II diamonds are transparent to all wavelength regimes except at around 2000 cm-1. | 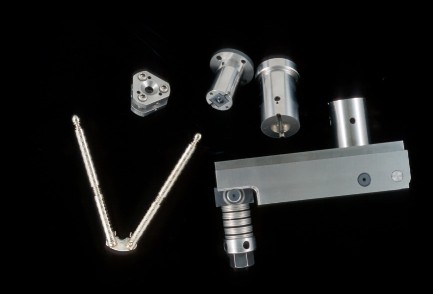
Fig. 1: Diamond anvil cells. Nutcraker (lower left) shown for scale. A triangular Merrill-Bassett cell is shown in the upper left. For the Mao-Bell diamond anvil cell, the piston and cylinder are shown disassembled (upper right) and assembled with the pressure-applying lever arm (lower right). The pressure is applied by turning the screw. |
When the DAC is fully assembled, the two cutlets are aligned to concentric, and also parallel by minimizing interference fringes observed through a binocular microscope. To create a thin film, the bulk sample (initially in pellet, chip, or powder form) is first mechanically crushed into ~ micron-sized particulates. The crushed sample is mounded onto one of the diamond tips. Surface tension holds the crushed particulates onto the diamond tip; further compression yields a thin film (thickness ~ 0.4 to 2 microns) with no visible crosshatching or cracks and little granularity. For each thin film created, efforts are made to cover the entire diamond tip (diameter = 0.6 mm) with an even layer of sample, but slight irregularities in the thickness are inevitable, partly due to the slight slope of the diamond faces.
Thickness has been established by comparing thin film spectra of garnets with ion-milled single crystal data [3] and by a boot-strapping method that takes advantage of the moderate band-strengths of hydroxyl in hydrosilicates [4].
For comparison, we show a thick single crystal of fayalite, after compression to 32 GPa (Fig. 2), and its corresponding spectrum (Fig. 3). The crystal shows cracking due to the extreme pressures. A relatively thick film of olivine (87% Mg2SiO4 + 13% Fe2SiO4 from Balsam Gap, N.C.) is shown in Fig. 4. Much of the relief is due to a layer of petroleum jelly, about 50 microns thick, used as a pressure medium. Thin films are considerably more uniform than the examples shown here.
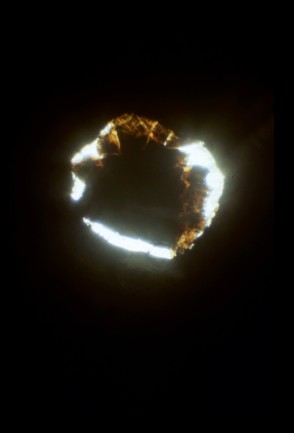
Fig. 2: View inside the diamond anvil cell of an initially 20 micron thick crystal plate [100] about 200 microns across of fayalite from Inyo Co, CA (94%Fe2SiO4 + 6% Mn2SiO4). The picture was taken at roughly a pressure of 1 GPa, after collection of spectra at very high pressures, shown in Fig. 3. The crystal had thinned to about 10-15 microns. |
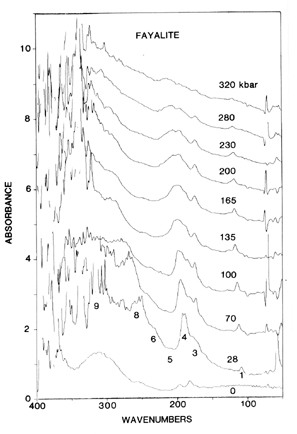
Fig. 3: Far-IR absorption spectra of the fayalite crystal shown in Fig. 2 taken during compression. Pressures are in kbar = 0.1 GPa. Spectra are offset for clarity, and features above 300 cm-1 are noise, due to the opacity of the sample. Features below 100 cm-1 are residuals of water vapor. The ambient pressure spectrum is from a powder dispersed in petroleum jelly. From [2]. |
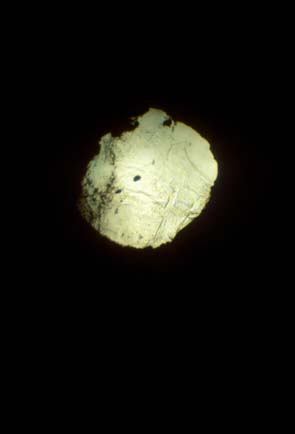
Fig. 4: Thick film (ca 10 microns) of mantle olivine at pressure < 10 GPa taken in a diamond anvil cell during compression. |
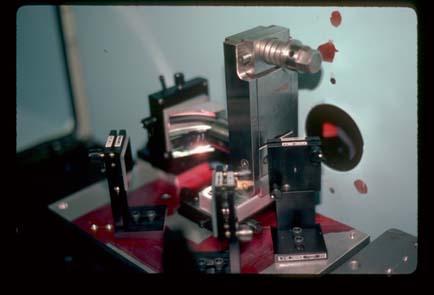
Fig. 5: Beam condenser used to interface the diamond anvil cell with the spectrometer. A parabolic mirror concentrates light at the top of the cylinder. Because the cell is asymmetric, a light cone inside the piston is used to maximize the throughput and serves as a focal point (but not a imaging point). |
Instrument Overview
Mid- and far-IR absorbance spectra are collected as described in [5] and [6]. Mid-IR spectra are acquired over the wavenumber range ~ 4000-400 cm-1 (wavelength ~ 2.2-25 micron) at either 1 or 2 cm-1 (~ 0.01 micron) resolution using a liquid-nitrogen-cooled HgCdTe detector, a KBr beamsplitter, and an evacuated Bomem DA 3.02 Fourier transform spectrometer (Fig. 5-6). The accuracy of the instrument is ~ 0.01 cm-1. The measured absorbance from the empty DAC serves as the reference spectrum. Far-IR absorption data from ~ 100 to 750 cm-1 at generally 1 cm-1 resolution are acquired using a liquid-He-cooled Si-bolometer and a coated, broadband mylar beam splitter, or various thicknesses of uncoated mylar beamsplitters. Occasionally we obtain spectra from powders dispersed in petroleum jelly on a polyethelene card using a liquid-helium-cooled DTGS (Deuterated TriGlycerine Sulfate) detector. Use of lower resolution (4 cm-1) for these measurements helps to minimize interference fringes. All mid- and far-IR absorbance spectral intensities are scaled to match in the wavenumber region of overlap and merged. Because scattering increases apparent absorption, the segment with the lowest absorbance values is presumed to be correct. The IDALS spectral database includes both raw unscaled and published merged absorbance spectra.
| References:
[1] Speck A.K., Hofmeister A.M., Barlow M.J., 2000, Thermal Emission Spectroscopy and Analysis of Dust, Disks, and Regoliths, Proceedings of a meeting held at The Lunar and Planetary Institute, 28-30 April, 1999, edited by Michael L. Sitko, Ann L. Sprague, and David K. Lynch, Astronomical Society of the Pacific Conference Series vol. 196, p. 281-290 [2] Hofmeister, A.M., Xu J., Mao H.K., Bell P.M., Hoering T.C., 1989, Thermodynamics of Fe-Mg olivines at mantle pressures: Mid- and far-infrared spectroscopy at pressure, American Mineralogist, 74, 281-306 [3] Hofmeister A.M., 1995, IR Microspectroscopy in Earth Science. In A Practical Guide to Infrared Microspectroscopy (H. J. Humecki, editor), p. 377-416 [4] Hofmeister A.M. and Bowey J.E., 2006, Quantitative IR spectra of hydrosilicates and related minerals, MNRAS, in press [5] Speck A.K., Hofmeister A.M., Barlow M.J., 1999, The SiC problem: Astronomical and meteoritic evidence, ApJ, 513, L87-L90 [6] Hofmeister A.M., Keppel E., Speck A.K., 2003, Absorption and
reflection infrared spectra of MgO and other diatomic compounds, MNRAS,
345, 16-38
|
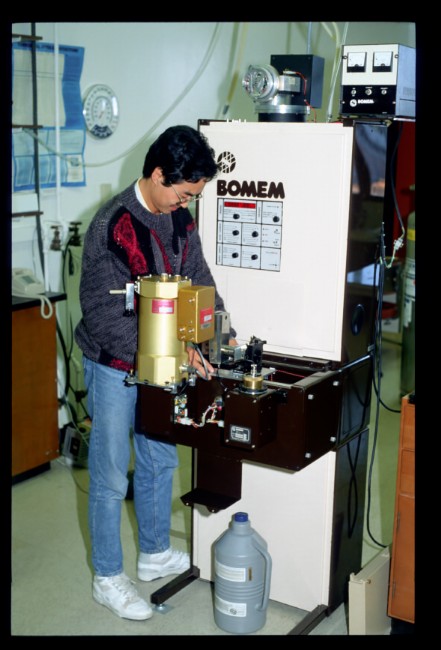
Fig. 6: Bomem DA 3.02 Fourier transform spectrometer, manufactured by Bomem Inc., Quebec, Canada. Former U.C. Davis graduate student, Ren Lu, is shown loading a diamond anvil cell and beam condensor into the spectrometer sample compartment. The gold-colored dewar holds liquid helium needed to cool the bolometer, used for acquiring spectra at far-IR wavelengths. The bolometer is manufactured by Infrared Industries, Tuscon AZ. |
Main
Content by AMH/KMP. Photographs and spectra by AMH. Last modified by KMP: Fri Jan 13 2006 15:25:29 CDT